
Silicon Valley by the Numbers · Working From Home by City
Working from home.
City by city.
One Census table shows the main way workers aged 16 and over get to work, including working from home, for 20 cities and towns and two counties. It counts workers where they live, not where the jobs are. Every figure is a survey estimate with a margin of error, read as of November 2026. Where estimates sit inside each other’s margins we do not rank them; cities are in alphabetical order.
See the numbers ↓On this page
- How many workers work from home in each city? About one in four, county-wide.
- How do workers get to work in each city? Chiefly by car, alone.
- Where do workers take transit, walk or cycle? Small shares. Real differences.
- Has working from home grown since 2015–2019? Yes. In every place here.
- What this means. For a home search.
- How we measured
- Common questions
The short answer
About one in four workers living in Silicon Valley’s two counties worked from home in the U.S. Census Bureau’s American Community Survey 2020–2024 5-year estimates, released January 29, 2026: 23.9% in Santa Clara County (±0.4 points) and 24.3% in San Mateo County (±0.6). In the 2015–2019 estimates the shares were 5.0% and 5.3%. Driving alone is still the leading way to work in both counties, at 59.9% and 56.7%. These figures count workers by where they live, not by where their jobs are.
01 · worked from home by city
How many workers work from home in each city?
About one in four, county-wide.
In the 2020–2024 estimates, 231,784 workers living in Santa Clara County worked from home (±4,385) out of 970,790 workers aged 16 and over, or 23.9%. In San Mateo County it was 93,277 (±2,301) out of 384,595, or 24.3%.
City by city the share is above 15% in all 20 places, even at the low end of each margin. The whole range sits above 30% in seven: Atherton, Foster City, Los Altos, Los Altos Hills, Palo Alto, Portola Valley and Saratoga. It sits below 30% in four: Redwood City, San Jose, San Mateo and Santa Clara. San Jose, at 20.3% (±0.5 points), is the one city whose whole range is below 25%.
Small towns carry wide margins. Six places have fewer than 5,000 workers in the estimate: Atherton, Hillsborough, Los Altos Hills, Monte Sereno, Portola Valley and Woodside. Portola Valley reads 49.1%, plus or minus 13.1 points, on 1,457 workers. Read the table as ranges, not as an order.
Workers who worked from home, by place of residence
Percent of workers 16 and over living in each place, two counties and 20 cities and towns, ACS 2020–2024 5-year estimates. Cities in alphabetical order. Bars show estimates without margins; margins of error are in the table and are wide for the six smallest towns.
Show these numbers as a table
| Worked from home | |
|---|---|
| Santa Clara County | 23.9% |
| San Mateo County | 24.3% |
| Atherton | 40.8% |
| Belmont | 33.7% |
| Cupertino | 31.8% |
| Foster City | 34.2% |
| Hillsborough | 36.3% |
| Los Altos | 39.4% |
| Los Altos Hills | 44.3% |
| Los Gatos | 33.0% |
| Menlo Park | 32.4% |
| Monte Sereno | 27.5% |
| Mountain View | 30.6% |
| Palo Alto | 35.4% |
| Portola Valley | 49.1% |
| Redwood City | 26.7% |
| San Jose | 20.3% |
| San Mateo | 24.8% |
| Santa Clara | 25.7% |
| Saratoga | 37.4% |
| Sunnyvale | 29.2% |
| Woodside | 30.5% |
Source: U.S. Census Bureau.
| City or county | Workers 16 and over | Worked from home (workers) | Worked from home (share) | Low to high end of the range |
|---|---|---|---|---|
| Santa Clara County | 970,790 ±4,277 | 231,784 ±4,385 | 23.9% ±0.4 | 23.4% to 24.3% |
| San Mateo County | 384,595 ±2,819 | 93,277 ±2,301 | 24.3% ±0.6 | 23.7% to 24.8% |
| Atherton | 2,716 ±249 | 1,107 ±200 | 40.8% ±6.3 | 34.4% to 47.1% |
| Belmont | 13,723 ±681 | 4,628 ±692 | 33.7% ±4.8 | 29.0% to 38.5% |
| Cupertino | 28,088 ±636 | 8,933 ±649 | 31.8% ±2.2 | 29.6% to 34.0% |
| Foster City | 16,647 ±631 | 5,696 ±499 | 34.2% ±2.7 | 31.5% to 36.9% |
| Hillsborough | 4,619 ±344 | 1,678 ±337 | 36.3% ±6.8 | 29.6% to 43.1% |
| Los Altos | 13,218 ±434 | 5,204 ±483 | 39.4% ±3.4 | 36.0% to 42.8% |
| Los Altos Hills | 3,542 ±334 | 1,569 ±305 | 44.3% ±7.5 | 36.8% to 51.8% |
| Los Gatos | 14,964 ±607 | 4,943 ±569 | 33.0% ±3.6 | 29.5% to 36.6% |
| Menlo Park | 16,340 ±602 | 5,295 ±562 | 32.4% ±3.2 | 29.2% to 35.6% |
| Monte Sereno | 1,400 ±205 | 385 ±127 | 27.5% ±8.1 | 19.4% to 35.6% |
| Mountain View | 48,164 ±1,176 | 14,747 ±1,161 | 30.6% ±2.3 | 28.3% to 32.9% |
| Palo Alto | 32,286 ±959 | 11,414 ±925 | 35.4% ±2.7 | 32.7% to 38.0% |
| Portola Valley | 1,457 ±261 | 716 ±230 | 49.1% ±13.1 | 36.0% to 62.2% |
| Redwood City | 43,358 ±1,055 | 11,594 ±816 | 26.7% ±1.8 | 25.0% to 28.5% |
| San Jose | 504,395 ±3,900 | 102,421 ±2,665 | 20.3% ±0.5 | 19.8% to 20.8% |
| San Mateo | 54,886 ±1,347 | 13,588 ±980 | 24.8% ±1.7 | 23.1% to 26.4% |
| Santa Clara | 73,978 ±1,573 | 18,991 ±1,311 | 25.7% ±1.7 | 24.0% to 27.4% |
| Saratoga | 13,249 ±732 | 4,956 ±624 | 37.4% ±4.2 | 33.2% to 41.6% |
| Sunnyvale | 86,100 ±1,595 | 25,157 ±1,362 | 29.2% ±1.5 | 27.7% to 30.7% |
| Woodside | 2,351 ±174 | 717 ±187 | 30.5% ±7.6 | 22.9% to 38.1% |
Source: U.S. Census Bureau.
Property Nerd note. The survey asks for the way a worker usually got to work in the week before answering. A worker who used different ways on different days gave the one used on the greater number of days. So a week spent mainly at a workplace is counted under that commute, not as working from home.
02 · ways to work by city
How do workers get to work in each city?
Chiefly by car, alone.
Driving alone is still the leading line: 59.9% of workers living in Santa Clara County (±0.4 points) and 56.7% in San Mateo County (±0.6). Carpooling adds 9.0% and 8.7%.
Drove alone is clearly ahead of every other line in both counties and in 16 of the 20 places. In the other four, Atherton, Hillsborough, Los Altos Hills and Portola Valley, the ranges for drove alone and worked from home overlap, so neither is clearly first. Worked from home is clearly ahead of carpooling, public transportation, walking and bicycle in all 22 areas.
The drove-alone share is above half, even at the low end of its margin, in nine cities: Cupertino, Los Gatos, Monte Sereno, Redwood City, San Jose, San Mateo, Santa Clara, Saratoga and Sunnyvale. In San Jose the whole range is above 60% (62.9%, ±0.7). In Palo Alto the whole range is below half (44.2%, ±2.3). San Jose is also the one city where carpooling is clearly above 10% (10.7%, ±0.4).
How workers get to work, share by place of residence
Percent of workers 16 and over living in each place, two counties and 20 cities and towns, ACS 2020–2024 5-year estimates. Cities in alphabetical order. Bars show estimates without margins; margins of error are in the table and are wide for the six smallest towns.
- Drove alone
- Carpooled
- Public transportation, walked, bicycle or other
- Worked from home
Show these numbers as a table
| Drove alone | Carpooled | Public transportation, walked, bicycle or other | Worked from home | |
|---|---|---|---|---|
| Santa Clara County | 59.9% | 9.0% | 7.3% | 23.9% |
| San Mateo County | 56.7% | 8.7% | 10.4% | 24.3% |
| Atherton | 44.9% | 7.0% | 7.4% | 40.8% |
| Belmont | 52.2% | 6.1% | 8.0% | 33.7% |
| Cupertino | 58.3% | 4.3% | 5.6% | 31.8% |
| Foster City | 51.8% | 7.5% | 6.4% | 34.2% |
| Hillsborough | 51.8% | 5.1% | 6.7% | 36.3% |
| Los Altos | 50.7% | 4.2% | 5.8% | 39.4% |
| Los Altos Hills | 48.4% | 1.6% | 5.7% | 44.3% |
| Los Gatos | 57.1% | 4.5% | 5.4% | 33.0% |
| Menlo Park | 48.4% | 6.0% | 13.2% | 32.4% |
| Monte Sereno | 63.7% | 6.1% | 2.7% | 27.5% |
| Mountain View | 51.8% | 5.4% | 12.2% | 30.6% |
| Palo Alto | 44.2% | 4.6% | 15.9% | 35.4% |
| Portola Valley | 47.4% | 0.0% | 3.4% | 49.1% |
| Redwood City | 55.3% | 9.5% | 8.5% | 26.7% |
| San Jose | 62.9% | 10.7% | 6.1% | 20.3% |
| San Mateo | 57.7% | 7.0% | 10.6% | 24.8% |
| Santa Clara | 58.2% | 7.3% | 8.8% | 25.7% |
| Saratoga | 55.7% | 3.5% | 3.4% | 37.4% |
| Sunnyvale | 53.7% | 8.3% | 8.8% | 29.2% |
| Woodside | 57.8% | 6.1% | 5.6% | 30.5% |
Source: U.S. Census Bureau.
| City or county | Drove alone | Carpooled | Public transportation | Walked | Bicycle | Other | Worked from home |
|---|---|---|---|---|---|---|---|
| Santa Clara County | 59.9% (±0.4) | 9.0% (±0.3) | 2.3% (±0.1) | 2.1% (±0.1) | 1.4% (±0.1) | 1.5% (±0.1) | 23.9% (±0.4) |
| San Mateo County | 56.7% (±0.6) | 8.7% (±0.4) | 5.1% (±0.3) | 2.3% (±0.2) | 1.2% (±0.2) | 1.8% (±0.2) | 24.3% (±0.6) |
| Atherton | 44.9% (±5.9) | 7.0% (±3.9) | 1.7% (±1.9) | 3.8% (±2.5) | 0.5% (±0.6) | 1.4% (±1.6) | 40.8% (±6.3) |
| Belmont | 52.2% (±4.2) | 6.1% (±1.7) | 4.7% (±1.9) | 2.0% (±0.9) | 0.5% (±0.3) | 0.8% (±0.7) | 33.7% (±4.8) |
| Cupertino | 58.3% (±2.2) | 4.3% (±1.0) | 0.9% (±0.3) | 2.5% (±0.8) | 1.1% (±0.5) | 1.2% (±0.5) | 31.8% (±2.2) |
| Foster City | 51.8% (±3.7) | 7.5% (±1.7) | 2.9% (±0.8) | 1.7% (±0.8) | 1.0% (±0.5) | 0.9% (±0.4) | 34.2% (±2.7) |
| Hillsborough | 51.8% (±7.9) | 5.1% (±2.9) | 1.9% (±1.5) | 1.1% (±0.9) | 0.7% (±1.0) | 3.0% (±1.7) | 36.3% (±6.8) |
| Los Altos | 50.7% (±2.8) | 4.2% (±1.2) | 0.7% (±0.4) | 1.9% (±0.9) | 2.3% (±0.7) | 1.0% (±0.6) | 39.4% (±3.4) |
| Los Altos Hills | 48.4% (±7.4) | 1.6% (±1.3) | 1.3% (±1.8) | 2.3% (±1.8) | 0.8% (±1.2) | 1.3% (±1.2) | 44.3% (±7.5) |
| Los Gatos | 57.1% (±3.7) | 4.5% (±1.5) | 1.4% (±0.8) | 2.3% (±0.9) | 0.5% (±0.5) | 1.2% (±0.7) | 33.0% (±3.6) |
| Menlo Park | 48.4% (±4.8) | 6.0% (±1.4) | 2.0% (±0.9) | 1.7% (±1.0) | 8.2% (±1.9) | 1.3% (±0.8) | 32.4% (±3.2) |
| Monte Sereno | 63.7% (±6.4) | 6.1% (±6.2) | 0.0% (±1.0) | 0.0% (±1.0) | 1.0% (±1.4) | 1.7% (±2.4) | 27.5% (±8.1) |
| Mountain View | 51.8% (±2.4) | 5.4% (±0.8) | 3.9% (±0.8) | 2.5% (±0.6) | 3.8% (±0.6) | 1.9% (±0.6) | 30.6% (±2.3) |
| Palo Alto | 44.2% (±2.3) | 4.6% (±1.3) | 2.0% (±0.6) | 4.6% (±1.2) | 7.9% (±1.3) | 1.4% (±0.5) | 35.4% (±2.7) |
| Portola Valley | 47.4% (±12.1) | 0.0% (±1.0) | 0.0% (±1.0) | 2.6% (±3.1) | 0.8% (±1.4) | 0.0% (±1.7) | 49.1% (±13.1) |
| Redwood City | 55.3% (±1.9) | 9.5% (±1.5) | 3.8% (±0.7) | 2.4% (±0.6) | 1.1% (±0.3) | 1.1% (±0.4) | 26.7% (±1.8) |
| San Jose | 62.9% (±0.7) | 10.7% (±0.4) | 2.4% (±0.2) | 1.8% (±0.2) | 0.5% (±0.1) | 1.4% (±0.1) | 20.3% (±0.5) |
| San Mateo | 57.7% (±1.8) | 7.0% (±1.0) | 4.9% (±1.0) | 2.7% (±0.7) | 0.5% (±0.3) | 2.5% (±0.7) | 24.8% (±1.7) |
| Santa Clara | 58.2% (±1.7) | 7.3% (±0.8) | 2.5% (±0.5) | 2.8% (±0.6) | 1.3% (±0.4) | 2.2% (±0.6) | 25.7% (±1.7) |
| Saratoga | 55.7% (±3.5) | 3.5% (±1.2) | 0.9% (±0.6) | 0.8% (±0.5) | 0.4% (±0.4) | 1.2% (±0.9) | 37.4% (±4.2) |
| Sunnyvale | 53.7% (±1.3) | 8.3% (±1.1) | 3.9% (±0.6) | 1.6% (±0.4) | 1.4% (±0.4) | 1.8% (±0.4) | 29.2% (±1.5) |
| Woodside | 57.8% (±8.3) | 6.1% (±4.0) | 2.1% (±1.9) | 2.4% (±1.6) | 1.0% (±1.1) | 0.1% (±1.2) | 30.5% (±7.6) |
Source: U.S. Census Bureau.
03 · transit walk bicycle
Where do workers take transit, walk or cycle?
Small shares. Real differences.
Public transportation is the main way to work for 2.3% of workers living in Santa Clara County (±0.1 points) and 5.1% in San Mateo County (±0.3). Walking is 2.1% and 2.3%, and bicycle 1.4% and 1.2%.
No city’s public transportation share is clearly above 5%. It is clearly above 2% in seven: Belmont, Foster City, Mountain View, Redwood City, San Jose, San Mateo and Sunnyvale. The ranges for San Mateo (4.9%, ±1.0) and Belmont (4.7%, ±1.9) include 5%. Monte Sereno and Portola Valley show an estimate of zero workers, with published margins of ±14 and ±14 workers (0.0%, ±1.0 and ±1.0 points).
Bicycle stands out in two cities. The whole range is above 5% in Menlo Park (8.2%, ±1.9) and Palo Alto (7.9%, ±1.3), and above 3% in Mountain View (3.8%, ±0.6). In the other 17 places the whole range is below 3%. Walking is clearly above 2% in Palo Alto (4.6%, ±1.2), San Mateo and Santa Clara.
Public transportation, walking and bicycle, by place of residence
Percent of workers 16 and over living in each place, two counties and 20 cities and towns, ACS 2020–2024 5-year estimates. Cities in alphabetical order. Bars show estimates without margins; margins of error are in the table and are wide for the six smallest towns.
- Public transportation
- Walked
- Bicycle
Show these numbers as a table
| Public transportation | Walked | Bicycle | |
|---|---|---|---|
| Santa Clara County | 2.3% | 2.1% | 1.4% |
| San Mateo County | 5.1% | 2.3% | 1.2% |
| Atherton | 1.7% | 3.8% | 0.5% |
| Belmont | 4.7% | 2.0% | 0.5% |
| Cupertino | 0.9% | 2.5% | 1.1% |
| Foster City | 2.9% | 1.7% | 1.0% |
| Hillsborough | 1.9% | 1.1% | 0.7% |
| Los Altos | 0.7% | 1.9% | 2.3% |
| Los Altos Hills | 1.3% | 2.3% | 0.8% |
| Los Gatos | 1.4% | 2.3% | 0.5% |
| Menlo Park | 2.0% | 1.7% | 8.2% |
| Monte Sereno | 0.0% | 0.0% | 1.0% |
| Mountain View | 3.9% | 2.5% | 3.8% |
| Palo Alto | 2.0% | 4.6% | 7.9% |
| Portola Valley | 0.0% | 2.6% | 0.8% |
| Redwood City | 3.8% | 2.4% | 1.1% |
| San Jose | 2.4% | 1.8% | 0.5% |
| San Mateo | 4.9% | 2.7% | 0.5% |
| Santa Clara | 2.5% | 2.8% | 1.3% |
| Saratoga | 0.9% | 0.8% | 0.4% |
| Sunnyvale | 3.9% | 1.6% | 1.4% |
| Woodside | 2.1% | 2.4% | 1.0% |
Source: U.S. Census Bureau.
| City or county | Public transportation, all kinds | Bus | Long-distance train or commuter rail | Subway or elevated rail | Light rail, streetcar or trolley | Ferryboat |
|---|---|---|---|---|---|---|
| Santa Clara County | 22,653 ±1,302 | 13,157 ±1,008 | 4,890 ±506 | 1,705 ±342 | 2,851 ±667 | 50 ±44 |
| San Mateo County | 19,475 ±1,333 | 8,783 ±923 | 4,244 ±536 | 5,723 ±716 | 712 ±366 | 13 ±20 |
| Atherton | 46 ±52 | 46 ±52 | 0 ±19 | 0 ±19 | 0 ±19 | 0 ±19 |
| Belmont | 650 ±269 | 121 ±81 | 270 ±152 | 247 ±193 | 12 ±24 | 0 ±25 |
| Cupertino | 247 ±85 | 145 ±67 | 80 ±57 | 22 ±25 | 0 ±32 | 0 ±32 |
| Foster City | 490 ±139 | 184 ±82 | 185 ±84 | 121 ±65 | 0 ±29 | 0 ±29 |
| Hillsborough | 88 ±71 | 0 ±21 | 68 ±62 | 8 ±14 | 12 ±20 | 0 ±21 |
| Los Altos | 94 ±53 | 19 ±24 | 48 ±38 | 0 ±29 | 27 ±34 | 0 ±29 |
| Los Altos Hills | 46 ±65 | 16 ±43 | 0 ±19 | 30 ±45 | 0 ±19 | 0 ±19 |
| Los Gatos | 203 ±123 | 81 ±68 | 122 ±105 | 0 ±29 | 0 ±29 | 0 ±29 |
| Menlo Park | 327 ±150 | 133 ±109 | 191 ±98 | 3 ±7 | 0 ±29 | 0 ±29 |
| Monte Sereno | 0 ±14 | 0 ±14 | 0 ±14 | 0 ±14 | 0 ±14 | 0 ±14 |
| Mountain View | 1,875 ±373 | 734 ±214 | 758 ±250 | 61 ±52 | 322 ±156 | 0 ±32 |
| Palo Alto | 632 ±198 | 332 ±192 | 229 ±82 | 62 ±55 | 9 ±16 | 0 ±32 |
| Portola Valley | 0 ±14 | 0 ±14 | 0 ±14 | 0 ±14 | 0 ±14 | 0 ±14 |
| Redwood City | 1,660 ±305 | 717 ±278 | 717 ±150 | 119 ±65 | 107 ±114 | 0 ±32 |
| San Jose | 12,050 ±1,094 | 7,054 ±810 | 2,108 ±380 | 792 ±227 | 2,075 ±587 | 21 ±37 |
| San Mateo | 2,684 ±541 | 1,172 ±337 | 1,078 ±288 | 398 ±156 | 36 ±38 | 0 ±32 |
| Santa Clara | 1,824 ±360 | 1,310 ±339 | 276 ±109 | 169 ±81 | 69 ±72 | 0 ±32 |
| Saratoga | 124 ±81 | 24 ±35 | 54 ±55 | 25 ±41 | 21 ±31 | 0 ±29 |
| Sunnyvale | 3,400 ±524 | 2,114 ±505 | 912 ±184 | 281 ±124 | 85 ±69 | 8 ±14 |
| Woodside | 50 ±45 | 42 ±44 | 0 ±19 | 8 ±11 | 0 ±19 | 0 ±19 |
Source: U.S. Census Bureau.
04 · then and now
Has working from home grown since 2015–2019?
Yes. In every place here.
Between the 2015–2019 and 2020–2024 estimates the worked-from-home share rose 18.8 points in Santa Clara County (5.0% to 23.9%) and 19.0 points in San Mateo County (5.3% to 24.3%). Both changes are far larger than their combined margins of ±0.5 and ±0.6 points.
The two periods share no survey years, which is how the Census Bureau suggests comparing 5-year files. The rise is larger than the combined margin in all 20 cities and towns too. The margin on a change is wide in the small towns: Woodside reads +15.6 points with a combined margin of ±8.4, while San Jose reads +16.1 (±0.5). Los Altos reads +28.9 (±3.7).
The drove-alone share fell by more than its combined margin in all 22 areas: from 74.7% to 59.9% in Santa Clara County and from 67.8% to 56.7% in San Mateo County. Public transportation fell from 4.4% to 2.3% and from 11.0% to 5.1%. That drop is larger than the combined margin in both counties and in 12 cities, and inside it in eight places: Atherton, Belmont, Los Altos Hills, Los Gatos, Monte Sereno, Portola Valley, Saratoga and Woodside.
The 2020–2024 figure pools answers collected from 2020 through 2024. It is an average over those five years, not a reading for 2024 or for today.
Worked from home, then and now
Percent of workers 16 and over living in each place, two counties and 20 cities and towns, ACS 2015–2019 and ACS 2020–2024 5-year estimates. Bars show estimates without margins; margins of error are in the table and are wide for the six smallest towns.
- 2015–2019
- 2020–2024
Show these numbers as a table
| 2015–2019 | 2020–2024 | |
|---|---|---|
| Santa Clara County | 5.0% | 23.9% |
| San Mateo County | 5.3% | 24.3% |
| Atherton | 14.4% | 40.8% |
| Belmont | 5.6% | 33.7% |
| Cupertino | 5.3% | 31.8% |
| Foster City | 5.8% | 34.2% |
| Hillsborough | 13.0% | 36.3% |
| Los Altos | 10.5% | 39.4% |
| Los Altos Hills | 15.6% | 44.3% |
| Los Gatos | 7.9% | 33.0% |
| Menlo Park | 8.6% | 32.4% |
| Monte Sereno | 10.3% | 27.5% |
| Mountain View | 4.9% | 30.6% |
| Palo Alto | 9.8% | 35.4% |
| Portola Valley | 23.1% | 49.1% |
| Redwood City | 4.6% | 26.7% |
| San Jose | 4.2% | 20.3% |
| San Mateo | 5.7% | 24.8% |
| Santa Clara | 4.9% | 25.7% |
| Saratoga | 10.2% | 37.4% |
| Sunnyvale | 4.4% | 29.2% |
| Woodside | 14.9% | 30.5% |
Source: U.S. Census Bureau.
| City or county | Worked from home 2015–2019 | Worked from home 2020–2024 | Worked from home, change | Drove alone, change | Public transportation, change | Public transportation reading |
|---|---|---|---|---|---|---|
| Santa Clara County | 5.0% (±0.2) | 23.9% (±0.4) | +18.8 (±0.5) | −14.9 (±0.6) | −2.1 (±0.2) | Larger than the combined margin |
| San Mateo County | 5.3% (±0.2) | 24.3% (±0.6) | +19.0 (±0.6) | −11.1 (±0.8) | −5.9 (±0.5) | Larger than the combined margin |
| Atherton | 14.4% (±3.5) | 40.8% (±6.3) | +26.4 (±7.3) | −22.9 (±6.7) | −0.8 (±2.4) | Inside the combined margin |
| Belmont | 5.6% (±1.3) | 33.7% (±4.8) | +28.1 (±4.9) | −21.4 (±5.0) | −2.2 (±2.5) | Inside the combined margin |
| Cupertino | 5.3% (±1.1) | 31.8% (±2.2) | +26.5 (±2.4) | −20.8 (±2.8) | −2.6 (±0.9) | Larger than the combined margin |
| Foster City | 5.8% (±0.9) | 34.2% (±2.7) | +28.4 (±2.9) | −17.7 (±4.4) | −4.5 (±1.8) | Larger than the combined margin |
| Hillsborough | 13.0% (±2.6) | 36.3% (±6.8) | +23.3 (±7.2) | −19.8 (±8.5) | −3.2 (±2.2) | Larger than the combined margin |
| Los Altos | 10.5% (±1.4) | 39.4% (±3.4) | +28.9 (±3.7) | −26.2 (±3.8) | −2.3 (±1.1) | Larger than the combined margin |
| Los Altos Hills | 15.6% (±5.6) | 44.3% (±7.5) | +28.7 (±9.4) | −26.7 (±9.3) | +0.5 (±2.0) | Inside the combined margin |
| Los Gatos | 7.9% (±1.7) | 33.0% (±3.6) | +25.1 (±4.0) | −22.2 (±4.2) | +0.5 (±0.9) | Inside the combined margin |
| Menlo Park | 8.6% (±1.5) | 32.4% (±3.2) | +23.8 (±3.5) | −17.2 (±5.3) | −4.7 (±1.7) | Larger than the combined margin |
| Monte Sereno | 10.3% (±4.1) | 27.5% (±8.1) | +17.2 (±9.1) | −17.8 (±8.4) | −0.4 (±1.1) | Inside the combined margin |
| Mountain View | 4.9% (±0.7) | 30.6% (±2.3) | +25.7 (±2.4) | −17.2 (±3.0) | −3.4 (±1.2) | Larger than the combined margin |
| Palo Alto | 9.8% (±1.2) | 35.4% (±2.7) | +25.5 (±2.9) | −18.6 (±2.8) | −4.2 (±1.2) | Larger than the combined margin |
| Portola Valley | 23.1% (±7.7) | 49.1% (±13.1) | +26.1 (±15.2) | −19.6 (±15.1) | 0.0 (±1.2) | Inside the combined margin |
| Redwood City | 4.6% (±0.7) | 26.7% (±1.8) | +22.2 (±1.9) | −17.3 (±2.6) | −2.5 (±1.0) | Larger than the combined margin |
| San Jose | 4.2% (±0.2) | 20.3% (±0.5) | +16.1 (±0.5) | −12.8 (±0.8) | −2.1 (±0.3) | Larger than the combined margin |
| San Mateo | 5.7% (±0.6) | 24.8% (±1.7) | +19.1 (±1.8) | −9.4 (±2.3) | −6.7 (±1.4) | Larger than the combined margin |
| Santa Clara | 4.9% (±0.7) | 25.7% (±1.7) | +20.7 (±1.8) | −16.0 (±2.3) | −1.9 (±0.8) | Larger than the combined margin |
| Saratoga | 10.2% (±2.1) | 37.4% (±4.2) | +27.2 (±4.7) | −24.3 (±4.1) | −0.2 (±0.8) | Inside the combined margin |
| Sunnyvale | 4.4% (±0.5) | 29.2% (±1.5) | +24.8 (±1.6) | −19.1 (±2.0) | −2.9 (±1.0) | Larger than the combined margin |
| Woodside | 14.9% (±3.6) | 30.5% (±7.6) | +15.6 (±8.4) | −14.3 (±10.1) | +1.7 (±2.0) | Inside the combined margin |
Source: U.S. Census Bureau.
Property Nerd note. In workers, Santa Clara County went from 48,671 working from home (±1,536) to 231,784 (±4,385), while public transportation went from 42,965 (±1,480) to 22,653 (±1,302).
05 · home search
What this means.
For a home search.
City shares set the scene. Your own week decides. Four ways to use this page:
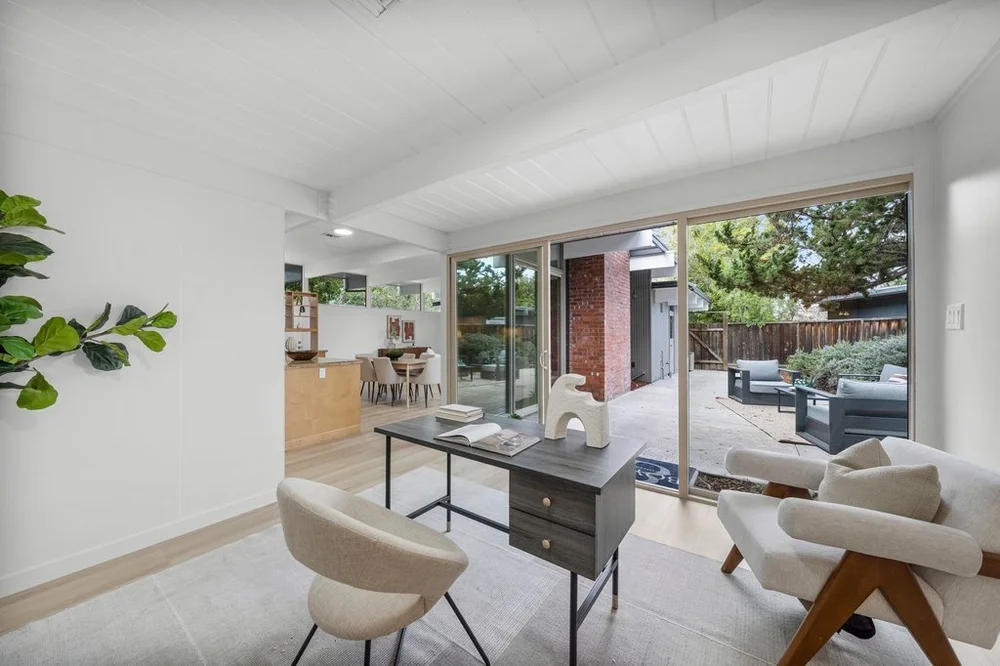
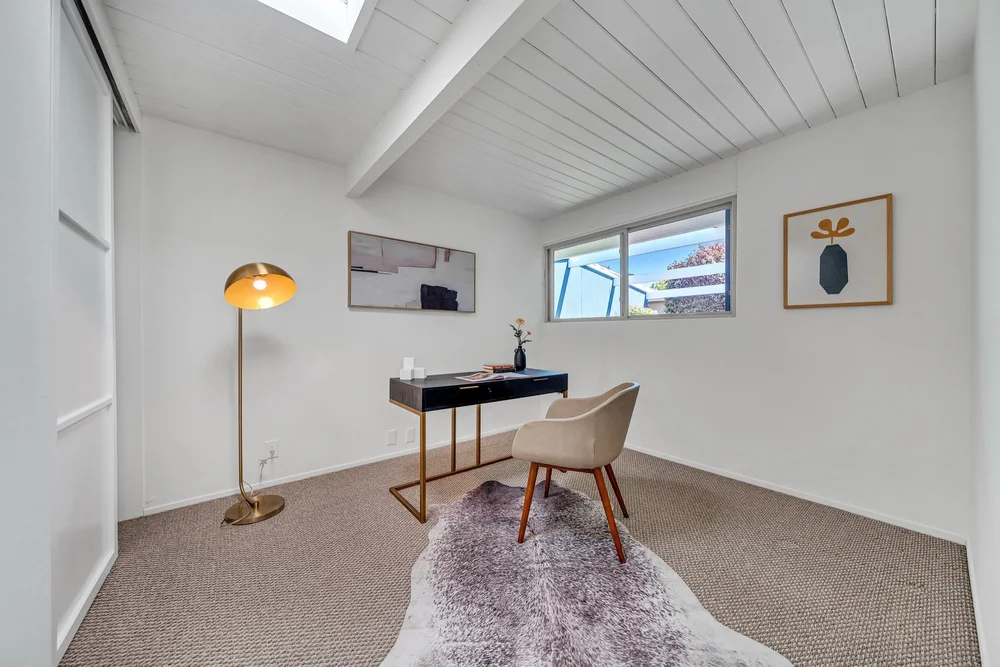
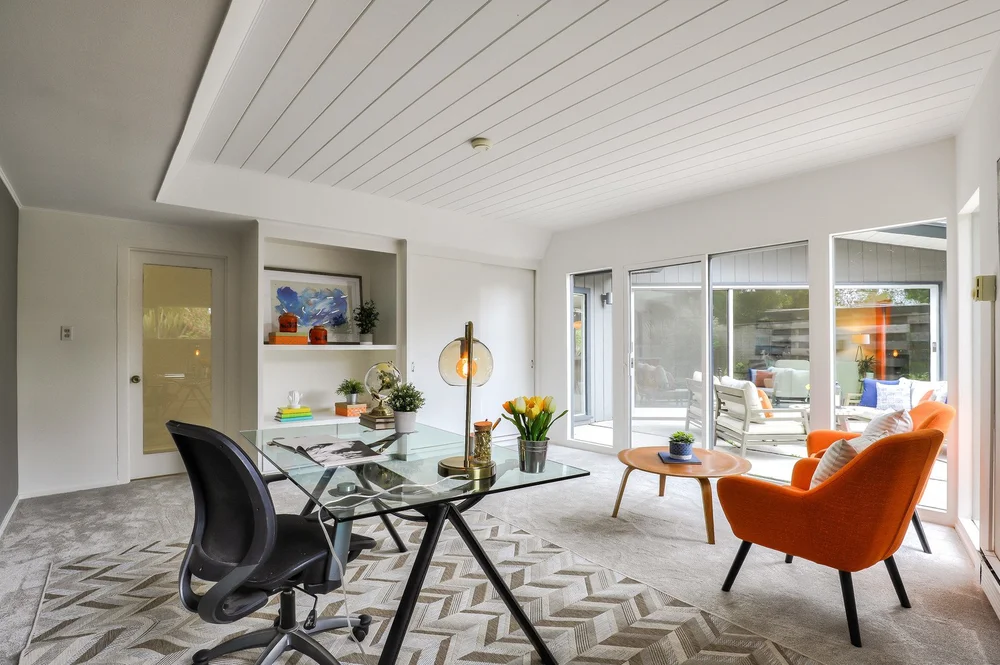
Think about the room you would work in. About one in four workers living in the two counties worked from home in the 2020–2024 estimates. Find your fit and the buyer tools can help.
Test the drive anyway. Driving alone is still the leading way to work in both counties. If you split the week between two offices, see the two-office commute home search and the guide for tech professionals.
Check transit, bike and walking routes by address. A city figure covers every worker living in that city; it is not a figure for one street. Start with getting around Silicon Valley.
Read these as facts about workers who live in a place, not about its employers or one address. Sellers: see the home selling guide.
Method
How we measured.
- Source: U.S. Census Bureau, American Community Survey (ACS) 5-year estimates, table B08301, Means of Transportation to Work, for 2020–2024 (released January 29, 2026, the newest 5-year release as of November 2026) and for 2015–2019. Both were read from the Bureau’s ACS Summary File on November 18, 2026.
- What is counted: workers 16 years and over who were at work in the week before they answered, by the way they usually got to work that week, one answer per worker. Workers are counted where they live, wherever the job is. This is not a count of jobs or of remote jobs in a city.
- Groups: drove alone, carpooled, public transportation, walked, bicycle and worked from home are Census lines. “Other” is our sum of three Census lines: taxi or ride-hailing services, motorcycle and other means. The third series in the stacked chart is our sum of public transportation, walked, bicycle and “Other”.
- Formulas: share = workers on a line ÷ all workers 16 and over × 100. Change = 2020–2024 share − 2015–2019 share, in percentage points. Combined margin = square root of (one margin squared + the other margin squared). A change larger than its combined margin passes the Census test for a difference at the 90 percent level.
- Margins of error: Census publishes each at the 90 percent confidence level; for a share we used the Census approximation for a proportion, so every share margin on this page is our calculation. For “Other” we first combined the three published margins as the square root of the sum of their squares, the Census approximation for a sum, which leaves out how the three lines move together. “Clearly above” or “whole range” means the estimate minus its margin is still above the level named. “Clearly ahead” means two ranges of worker counts do not overlap.
- Limits: these are period estimates pooled over five years, and the two periods share no survey years. Census reworded several answer choices beginning in 2019, so the 2015–2019 figures pool answers from before and after that change. In 2024 it relabelled the taxi choice and widened it to include ride-hailing services. The table has no line for part-week home working, travel time or job location.
- Rounding: shares and margins are rounded to one decimal for display, so rows may not add to exactly 100.0. Changes are worked out before rounding, so a change can differ by 0.1 from the rounded shares. Chart data keep full precision.
Questions
Common questions.
Plain answers.
What share of Silicon Valley workers work from home?
About one in four. In the ACS 2020–2024 5-year estimates, released January 29, 2026, 23.9% of workers living in Santa Clara County (±0.4 points) and 24.3% in San Mateo County (±0.6) worked from home. That is 231,784 and 93,277 workers.
Which Silicon Valley cities have higher work-from-home shares?
In the ACS 2020–2024 estimates the whole range, estimate minus margin, is above 30% in seven of the 20 places here: Atherton, Foster City, Los Altos, Los Altos Hills, Palo Alto, Portola Valley and Saratoga. Several are small towns with wide margins, so we do not rank them. San Jose is the one city whose whole range is below 25%, at 20.3% (±0.5 points).
Is working from home more common than before 2020?
Yes, in the survey. The share rose from 5.0% in the ACS 2015–2019 estimates to 23.9% in 2020–2024 in Santa Clara County, and from 5.3% to 24.3% in San Mateo County. The rise is larger than the combined margin of error in both counties and in all 20 cities and towns here.
How do workers in San Jose get to work?
Driving alone leads. In the ACS 2020–2024 estimates, 62.9% of the 504,395 workers living in San Jose drove alone (±0.7 points), 20.3% worked from home, 10.7% carpooled and 2.4% used public transportation.
Does a hybrid schedule count as working from home?
Only if home was where the worker worked on the greater number of days in the week before answering. The survey takes one answer per worker. A week spent mainly at a workplace is counted under that commute.
Does this show how many jobs in a city are remote?
No. Table B08301 counts workers by where they live. Palo Alto’s 35.4% (±2.7 points, ACS 2020–2024) is the share of workers living in Palo Alto who worked from home, whatever city their employer is in.
More data
Keep counting.
Every page in Silicon Valley by the Numbers is built from official public data, with the method shown.
558.75
Silicon Valley Home Price Index
San Jose-Sunnyvale-Santa Clara metro area index (1995 Q1 = 100). 2026 Q2, release of August 2026.
See the data →7.11%
Mortgage Rate History
30-year fixed, U.S. average. Week dated November 12, 2026.
See the data →737,988
Silicon Valley Housing Stock by City
Housing units, 20 cities combined (our sum). January 1, 2026 (provisional).
See the data →1975
When Silicon Valley Homes Were Built
Median year built, Santa Clara County (±1 year). ACS 2020–2024 5-year estimates, released January 29, 2026.
See the data →47,422
Silicon Valley New Housing Permits
Housing units issued building permits, 20 cities, 2018 to 2025 (our sum). File updated November 13, 2026.
See the data →74.8–88.8°F
Silicon Valley Climate by City
Normal daily high in each station’s warmest month, eight stations. 1991–2020 normals.
See the data →$1,249,125
Silicon Valley Conforming Loan Limits
One-unit limit, Santa Clara and San Mateo counties. 2026 limits, announced November 25, 2025.
See the data →1,119,582
Silicon Valley Jobs by Industry
Jobs at workplaces in Santa Clara County, 2025 annual average. BLS file dated August 21, 2026.
See the data →29.4%
Silicon Valley Homes by Bedroom Count
Santa Clara County housing units with three bedrooms (±0.4 points). ACS 2020–2024 5-year estimates, released January 29, 2026.
See the data →31,552
Silicon Valley Housing Growth by City
Net housing units added in the 20 cities since the 2020 benchmark (our sum). January 1, 2026 (provisional), compared with April 1, 2020. Released May 1, 2026.
See the data →58.5%
Silicon Valley Home Heating by City
Occupied homes heated mainly by utility gas, Santa Clara County (±0.5 points). ACS 2020–2024 5-year estimates, released January 29, 2026.
See the data →280,157
Silicon Valley Electric Vehicles and Home Charging
Zero-emission vehicles registered in Santa Clara and San Mateo counties (our sum). Data as of December 31, 2025.
See the data →Your next move
Read the numbers.
Then choose your part of the Valley.
Buying in Silicon Valley
Tell us where you work, how you like to get around and what kind of house you are after. We will help you compare cities and streets with that in mind.
See the buyer advantage ↗ Find your fit ↗Selling in Silicon Valley
Buyers ask about the area as much as the house. We help you present both clearly, from preparation to pricing to launch.
See the seller advantage ↗ What is my home worth? ↗Talk with the Boyenga Team at Compass: (408) 373-1660 or (650) 383-8606, or send us a note.